FIGURE LEGENDS
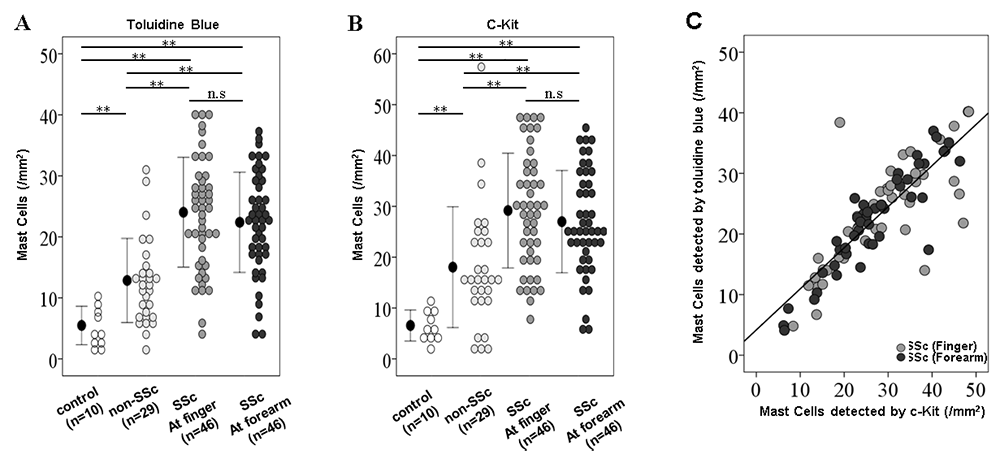
Figure 1. Increased density of dermal mast cells in SSc patients. In comparison with non-SSc and healthy control groups, the density of dermal mast cells was higher in the SSc group, as evaluated by both toluidine blue staining (A) and c-Kit immunostaining (B), irrespective of the site of biopsy (A, p<0.001; B, p<0.001). (C) A strong positive correlation was noted between the two methods used to analyze the density of mast cells in the dermis (entire group: R2=0.758, p<0.001; SSc group (at finger): R2=0.615, p<0.001; SSc group (at forearm): R2=0.823, p<0.001; non-SSc group: R2=0.591, p<0.001; control group: R2=0.877, p<0.001). Circles and bars represent the mean and SD. *p<0.05, **p<0.01. SSc=systemic sclerosis.
Figure 2. Histopathological findings in skin samples harvested from the fingers and forearm from representative patients with SSc (A-F), non-SSc (rheumatoid arthritis complicated with cutaneous vasculitis) (G-I) and normal control (J-L). Hematoxylin-eosin staining (A) showed deposition of thick collagen fibers. Toluidine blue staining (B) and c-Kit immunostaining (C) identified mast cells. On the other hand, specimen from forearm showed perivascular and interstitial edema as well as homogenization of collagen fiber in the dermis (D). There was no difference in morphology between mast cells from finger and forearm (E, F). Arrows indicate mast cells. Bar=50 μm. SSc=systemic sclerosis.
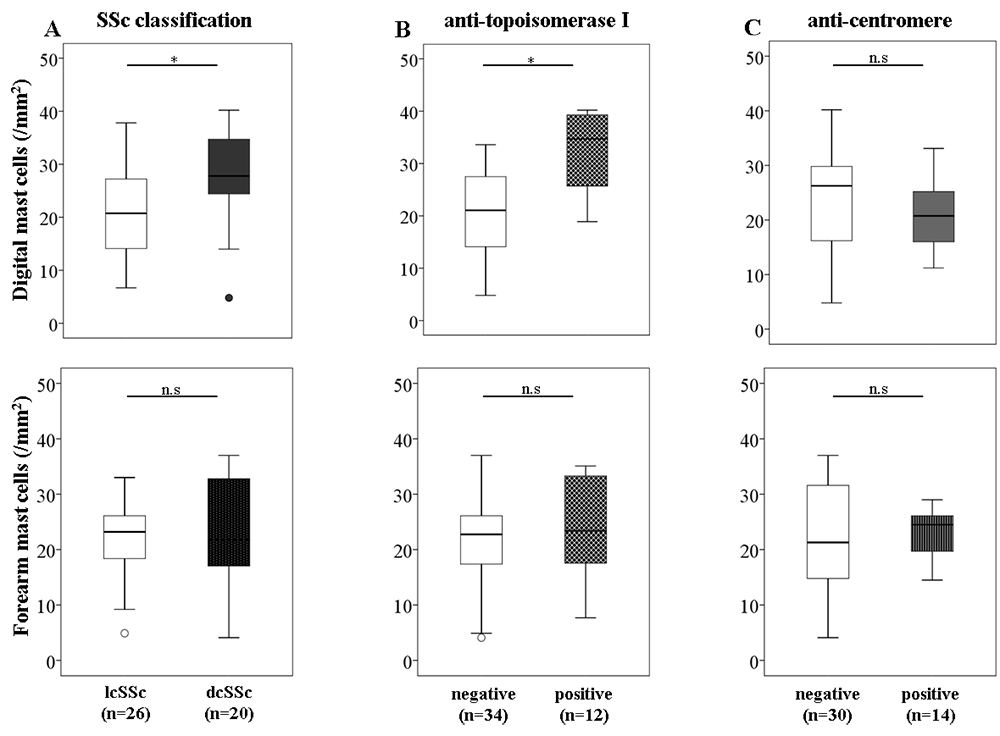
Figure 3. Dermal accumulation of mast cells in patients with diffuse cutaneous systemic sclerosis (dcSSc) positive for anti-topoisomerase I antibody. The density of mast cells at finger, but not at forearm, was significantly higher in dcSSc (p=0.004, p=0.956) (A) and anti-topoisomerase I antibody-positive patients (p=0.001, p=0.395) (B). (C) Positivity for anti-centromere antibody did not correlate with dermal mast cell density (p=0.124, p=0.399). Data are presented as box plots, where the boxes represent the 25th to 75th percentiles, the lines within the boxes represent the median, and the lines outside the boxes represent the minimum to 10th percentile and 90th percentile to maximum values, and the circle represents an outlier. *p<0.05, **p<0.01. lcSSc=limited cutaneous SSc.
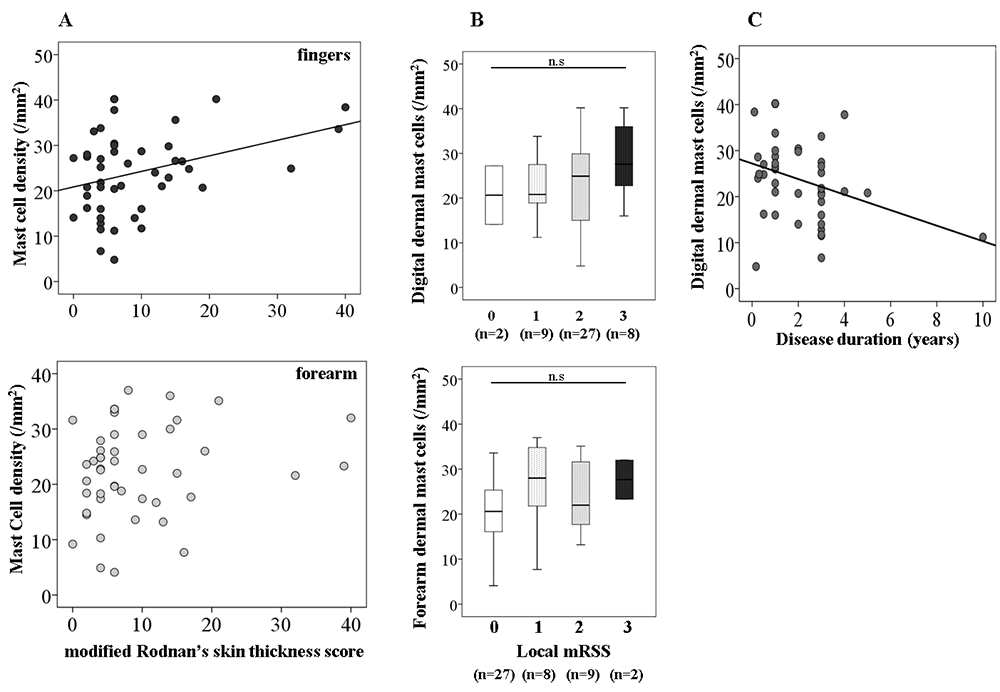
Figure 4. (A) Correlation between the density of mast cells at finger (top) and forearm (bottom) and severity of scleroderma (mRSS) (r2=0.118, r=0.344, p=0.019 (finger), r2=0.041, r=0.202, p=0.178 (forearm)). (B) Skin score for biopsy lesions in the fingers (top) and forearms (bottom). Data are presented as box plots, where the boxes represent the 25th to 75th percentiles, the lines within the boxes represent the median, and the lines outside the boxes represent the minimum to 10th percentile and 90th percentile to maximum values. (C) Correlation between the density of finger dermal mast cell density and disease duration. mRSS=modified Rodnan’s skin thickness score.


